readxl::excel_sheets("eurovision_song_contest_1975_2019.xlsx")
## [1] "Data" "Remarks" "Sources"
eurovision_raw <- readxl::read_excel("eurovision_song_contest_1975_2019.xlsx", sheet = "Data")
eurovision_proc <- eurovision_raw %>%
  janitor::clean_names() %>%
  filter(is.na(duplicate)) %>%
  select(-duplicate) %>%
  rename(show = semi_final,
         vote_type = jury_or_televoting) %>%
  mutate_at(vars(from_country), ~str_replace(., "The Netherands", "The Netherlands")) %>%
  mutate(
    show_type = as_factor(if_else(show == "f", "final", "semi-final")),
    show = fct_recode(show,
                      "final" = "f",
                      "single-semi" = "sf",
                      "semi-one" = "sf1",
                      "semi-two" = "sf2"),
    vote_type = fct_recode(vote_type,
                           "jury" = "J",
                           "televote" = "T"))
eurovision_country_code <- function(x) {

  code <- case_when(
    x == "Serbia & Montenegro" ~ "SCG",
    x == "Yugoslavia" ~ "YUG",
    TRUE ~ countrycode::countrycode(x, "country.name", "iso3c")
  )

  return(code)

}
eurovision_dt <- eurovision_proc %>%
  mutate_at(vars(from_country, to_country), eurovision_country_code)
## Warning in countrycode::countrycode(x, "country.name", "iso3c"): Some values were not matched unambiguously: Serbia & Montenegro, Yugoslavia

## Warning in countrycode::countrycode(x, "country.name", "iso3c"): Some values were not matched unambiguously: Serbia & Montenegro, Yugoslavia
calc_scores <- function(data) {

  scores <- data %>%
    group_by(to_country) %>%
    summarise(score = sum(points)) %>%
    ungroup()

  return(scores)

}

get_winner <- function(data) {

  winner <- data %>%
    filter(score == max(score)) %>%
    rename(winning_country = to_country, winning_score = score)

  return(winner)

}
eurovision_scores <- eurovision_dt %>%
  group_by(year, show) %>%
  nest(data = c(vote_type, from_country, to_country, points)) %>%
  mutate(
    scores = map(data, calc_scores),
    winner = map(scores, get_winner)) %>%
  select(-data) %>%
  unnest(winner) %>%
  unnest(scores) %>%
  mutate(
    overall_winner = winning_country == to_country,
    outcome = case_when(
      overall_winner & show_type == "final" ~ "win-final",
      overall_winner & show_type == "semi-final" ~ "win-semi",
      TRUE ~ "no-win"
    )) %>%
  rename(country = to_country) %>%
  group_by(country) %>%
  mutate(prev_wins = cumsum(overall_winner)) %>%
  ungroup() %>%
  mutate(prev_wins = if_else(prev_wins > 0, prev_wins - 1, 0))
deu_scores <- eurovision_scores %>%
  filter(country == "DEU") %>%
  filter(!(year == 1991 & winning_country == "FRA")) %>%
  select(year, DEU = score, Winner = winning_score) %>%
  pivot_longer(cols = -year, names_to = "country", values_to = "score")
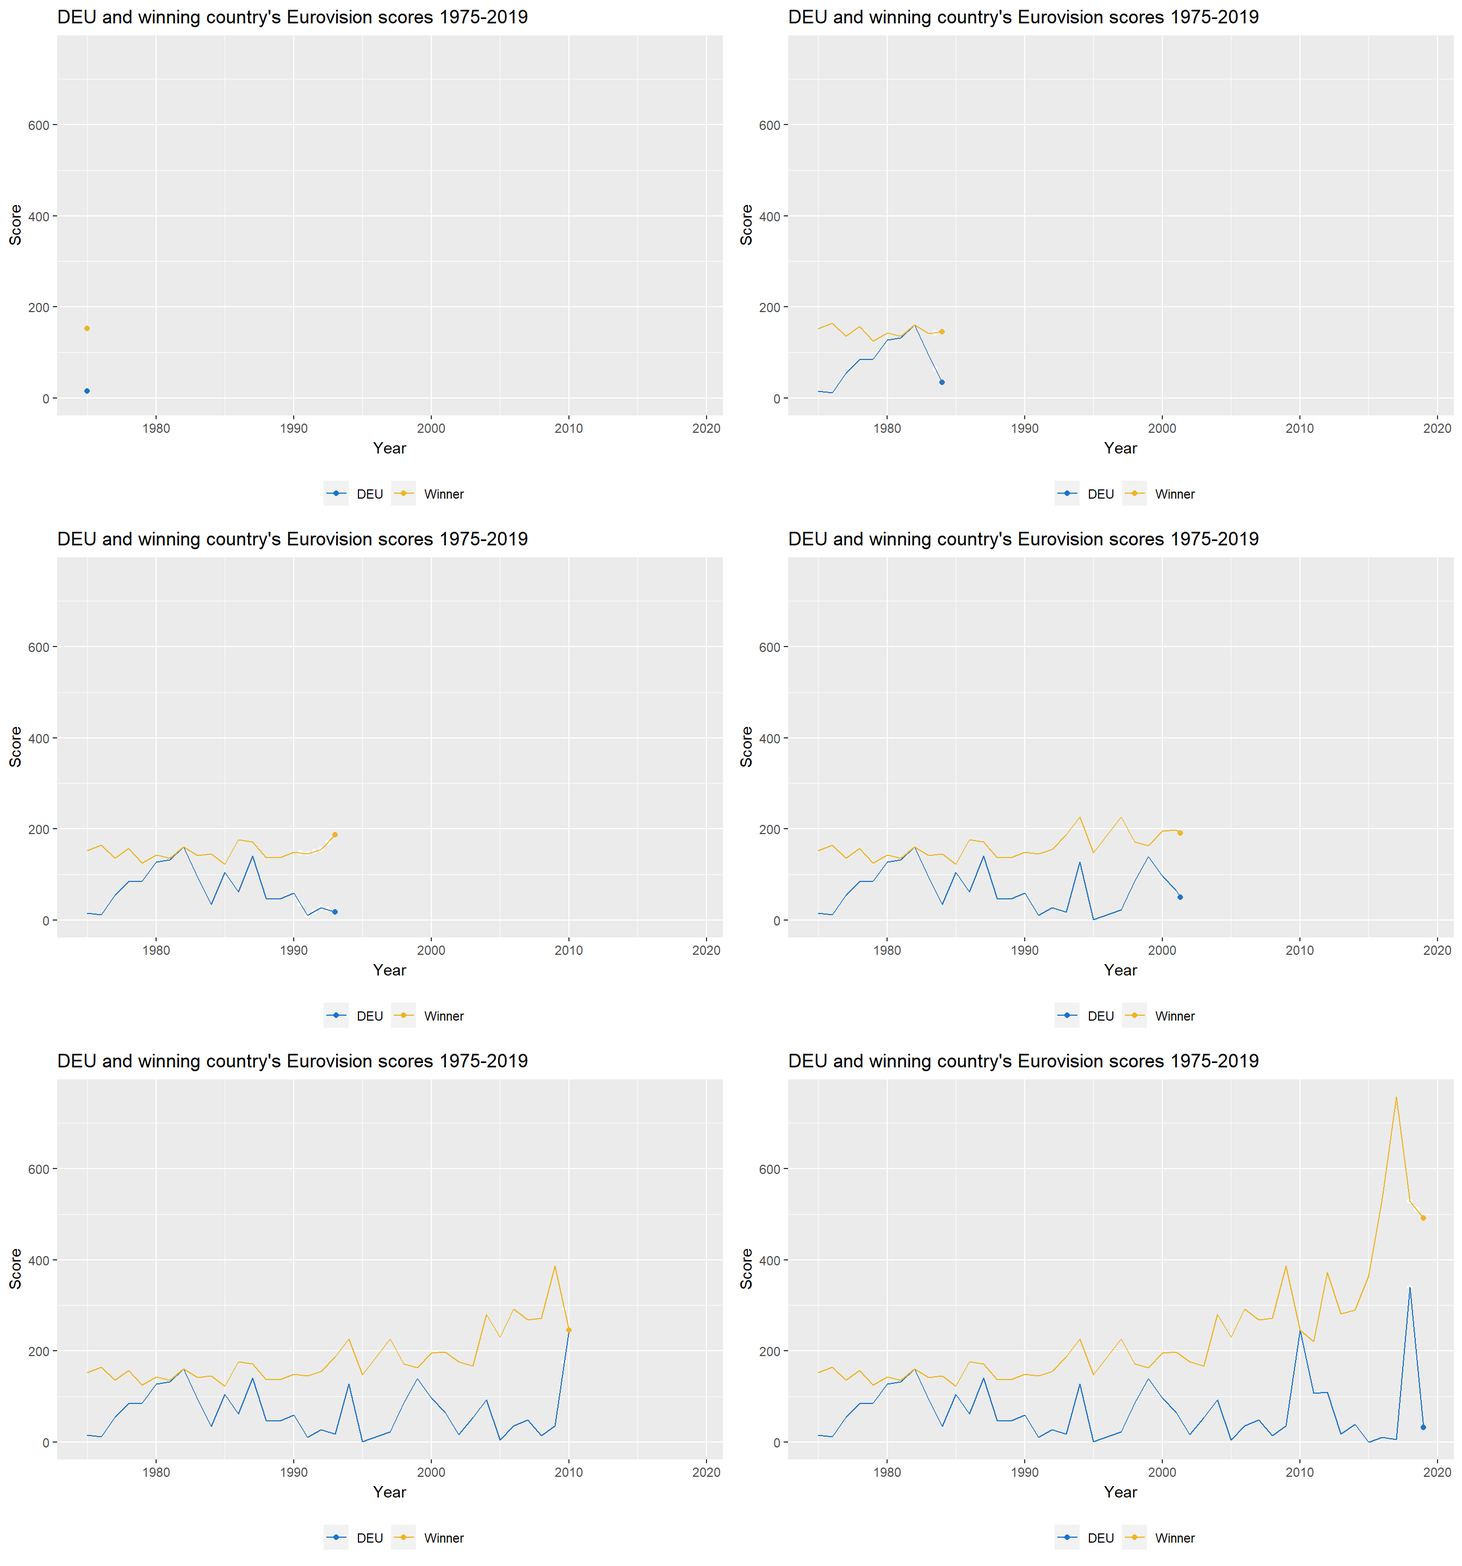
p_line <- ggplot(deu_scores, aes(x = year, y = score, colour = country)) +
  geom_line() +
  geom_point() +
  labs(title = "DEU and winning country's Eurovision scores 1975-2019",
       x = "Year",
       y = "Score") +
  scale_colour_manual(values = c("Winner" = "goldenrod2", "DEU" = "dodgerblue3")) +
  theme(plot.title = element_text(lineheight = 1.1), legend.title = element_blank(), legend.position = "bottom")

p_line

library(gganimate)

anim_line <- p_line +
  transition_reveal(year)

options(gganimate.dev_args = list(width = 900, height = 900*9/16))
anim_save("eurovision_deu_winner.gif", anim_line, fps = 5)

anim_line

world_countries <- rnaturalearth::ne_countries(returnclass = "sf")

world_cropped <- sf::st_crop(world_countries, xmin = -30, xmax = 155, ymin = -90, ymax = 90)
## although coordinates are longitude/latitude, st_intersection assumes that they are planar
## Warning: attribute variables are assumed to be spatially constant throughout all
## geometries
eurovision_countries <- world_cropped %>%
  filter(iso_a3 %in% unique(eurovision_scores$country)) %>%
  left_join(eurovision_scores, by = c("iso_a3" = "country")) %>%
  mutate(relative_score = score/winning_score)
p_map1 <- ggplot(eurovision_countries %>% filter(year == 2019)) +
  geom_sf(aes(fill = relative_score), size = 0.1, colour = "grey90") +
  scale_fill_gradient(low = "dodgerblue3", high = "goldenrod2",
                      guide = guide_none()) +
  labs(
    title = "Relative scores in the Eurovision Finals: 2019",
    subtitle = "Relative score = country score / winning score"
  ) +
  theme(
    axis.text = element_blank()
  )

p_map1

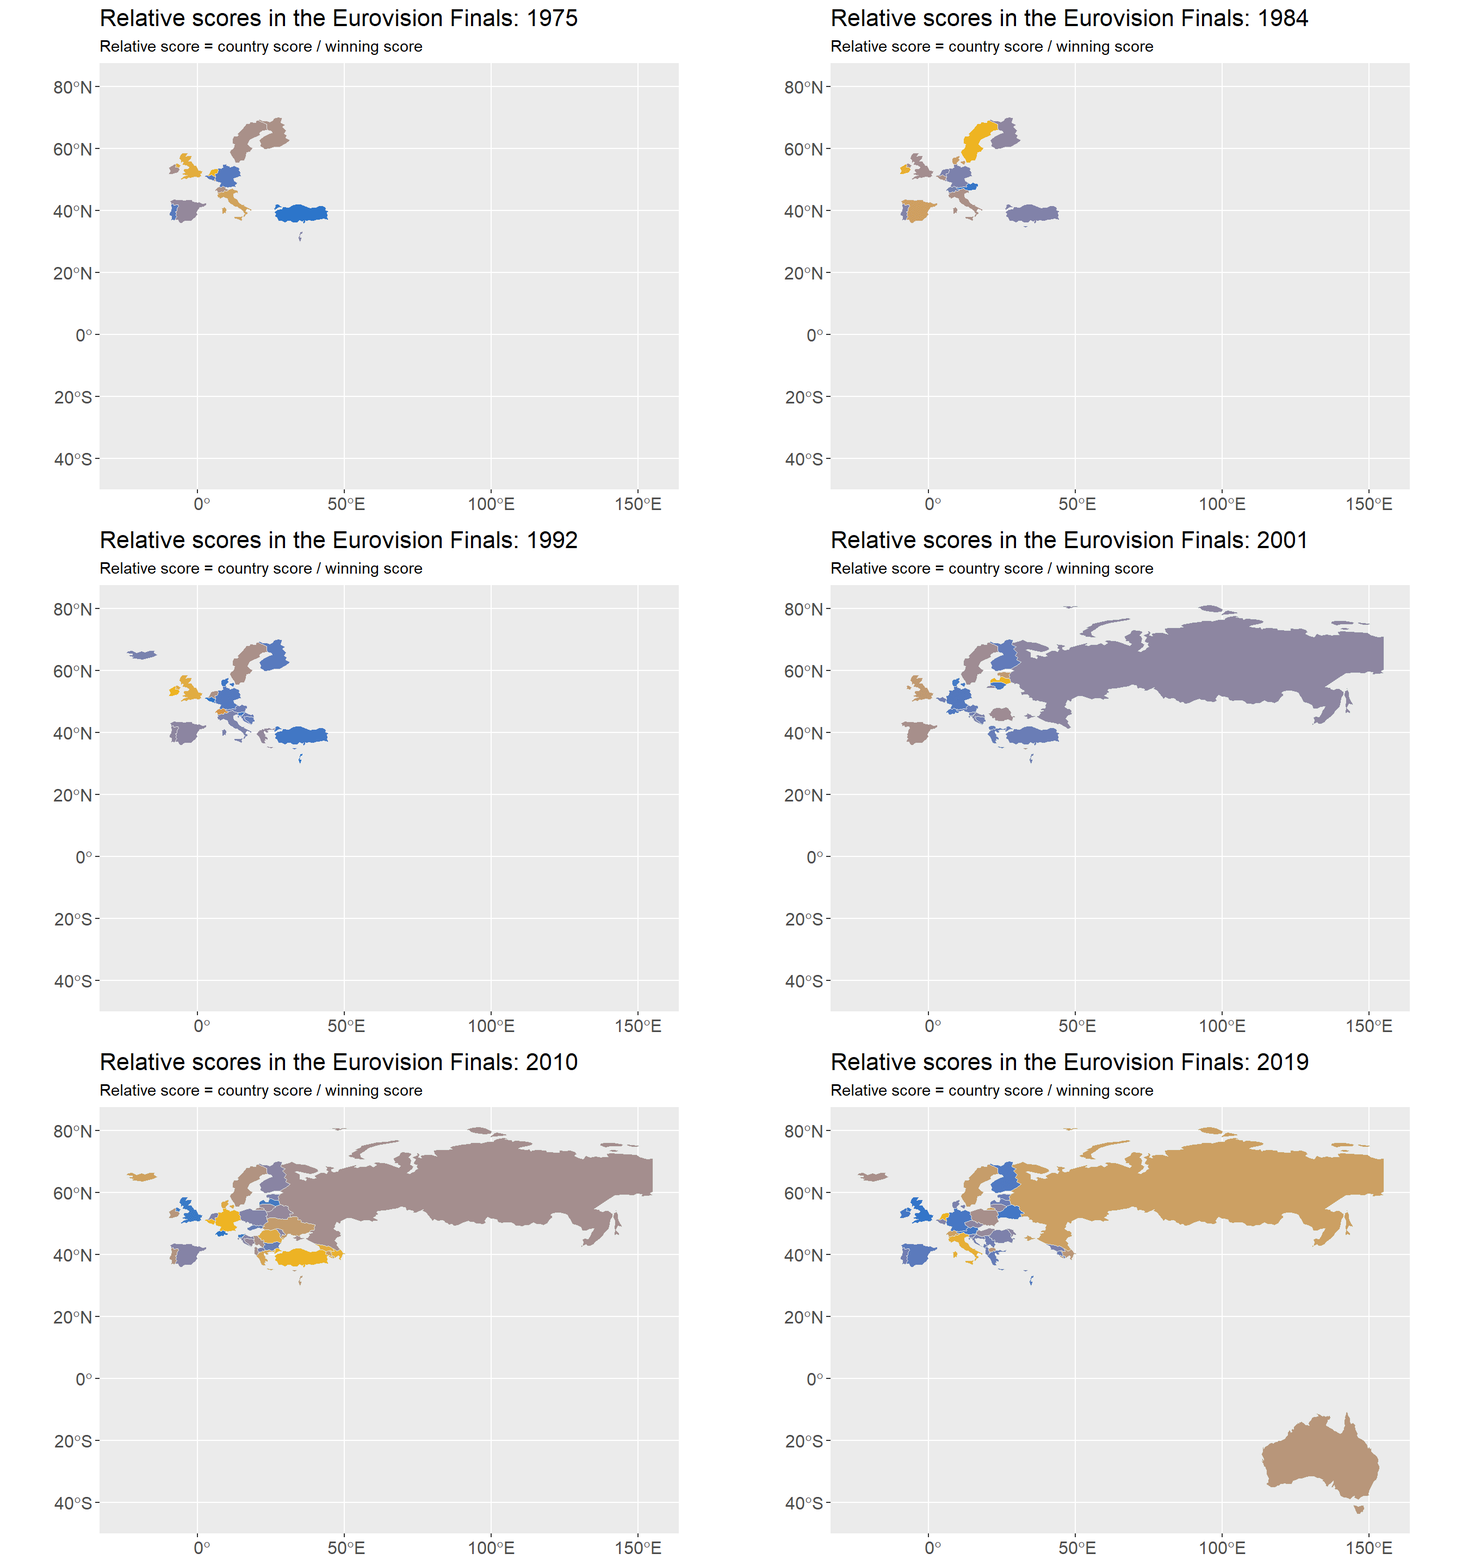
p_map2 <- ggplot(eurovision_countries) +
  geom_sf(aes(fill = relative_score), size = 0.1, colour = "grey90") +
  scale_fill_gradient(low = "dodgerblue3", high = "goldenrod2",
                      guide = guide_none()) +
  labs(
    title = "Relative scores in the Eurovision Finals: {closest_state}",
    subtitle = "Relative score = country score / winning score"
  ) +
  theme(
    axis.text = element_blank()
  )

anim_map <- p_map2 +
  transition_states(year) +
  theme(
    plot.title = element_text(size = 16),
    axis.title = element_text(size = 14),
    axis.text = element_text(size = 12),
    legend.text = element_text(size = 12)
  )

options(gganimate.dev_args = list(width = 750, height = 610))
anim_save("eurovision_timeseries", anim_map, fps = 5)

p_map2

anim_map


